
When you want to want to create a service that supports introspection using traces and also expose metrics you usually have to manually integrate APIs:
- OpenTracing for Jaeger
- A Prometheus client library to expose metrics to Prometheus
These are just two examples but as they reflect my current preferred tooling around traces and metrics I will list them here. If you want to switch from one vendor to another you usually end up having to replace big parts of these integrations.
And this is precisely what makes OpenCensus by Google so interesting: It acts as an abstraction layer where you define your metrics and traces and then plug in the actual export format somewhere else. If you, for instance, then want to switch from Prometheus + Jaeger to Stackdriver, you only have to replace the exporter implementation and can leave everything else just as it has been done before.
Tracking metrics
So, how do you integrate metrics and tracing with OpenCensus? Let’s
say you want to track the number of failed logins on your page. You
first have to define that metric somewhere (I tend to add them to a
metrics.go file):
package server

import (
	"go.opencensus.io/stats"
	"go.opencensus.io/stats/view"
	"go.opencensus.io/tag"
)

var (
	loginFailedTotal     = stats.Int64("login_failed_total", "Total number of failed logins", "1")
	loginFailedTotalView = &view.View{
		Name:        "login_failed_total",
		Measure:     loginFailedTotal,
		Aggregation: view.Count(),
		TagKeys:     []tag.Key{},
	}
)

func init() {
	view.Register(loginFailedTotalView)
}
If a login then fails, you record a new value using the stats.Record
function:
package server

import (
	"go.opencensus.io/stats"
)

func loginHandler(...) {
    // ...

    stats.Record(r.Context(), loginFailedTotal.M(1))

    // ...
}
This all looks quite similar to what you’d have to do in Prometheus. What’s left is the code that exposes the metric to the outside world.
package main

import (
	"contrib.go.opencensus.io/exporter/prometheus"
	"go.opencensus.io/stats/view"
)

func main() {
    // ...

    promex, _ := prometheus.NewExporter(prometheus.Options{Namespace: "myapp"})
    view.RegisterExporter(promex)

    mux.Handle("/metrics", promex)

    // ...
}
The metrics that are then exposed through /metrics also contain a
myapp_login_failed_total entry:
# HELP myapp_login_failed_total Total number of failed logins
# TYPE myapp_login_failed_total counter
myapp_login_failed_total 1
If you’d now have to support another metrics collector, you’d just
have to register another exporter with the view package and
(depending on the exporter) start it. The rest of the integration (the
metrics, the views, the Record-calls) can stay the same.
Traces
For traces, the story looks quite similar. You have a place where you do the actual tracing and configure an exporter that is responsible for submitting your traces to whatever backend you want to use.
import (
	"net/http"

	"contrib.go.opencensus.io/exporter/jaeger"
	"go.opencensus.io/trace"
)

func main() {
    // ...

	trace.ApplyConfig(trace.Config{
		DefaultSampler: trace.AlwaysSample(),
	})
	agentEndpointURI := "localhost:6831"
	collectorEndpointURI := "http://localhost:14268/api/traces"
	jex, _ := jaeger.NewExporter(jaeger.Options{
		AgentEndpoint:     agentEndpointURI,
		CollectorEndpoint: collectorEndpointURI,
		ServiceName:       "myapp",
	})
	trace.RegisterExporter(jex)

    // ...
}

func loginHandler(w http.ResponseWriter, r *http.Request) {
	ctx := r.Context()
	ctx, span := trace.StartSpan(ctx, "failed-login")
	span.AddAttributes(trace.StringAttribute("user", "some-user"))
	defer span.End()

    // ...
}
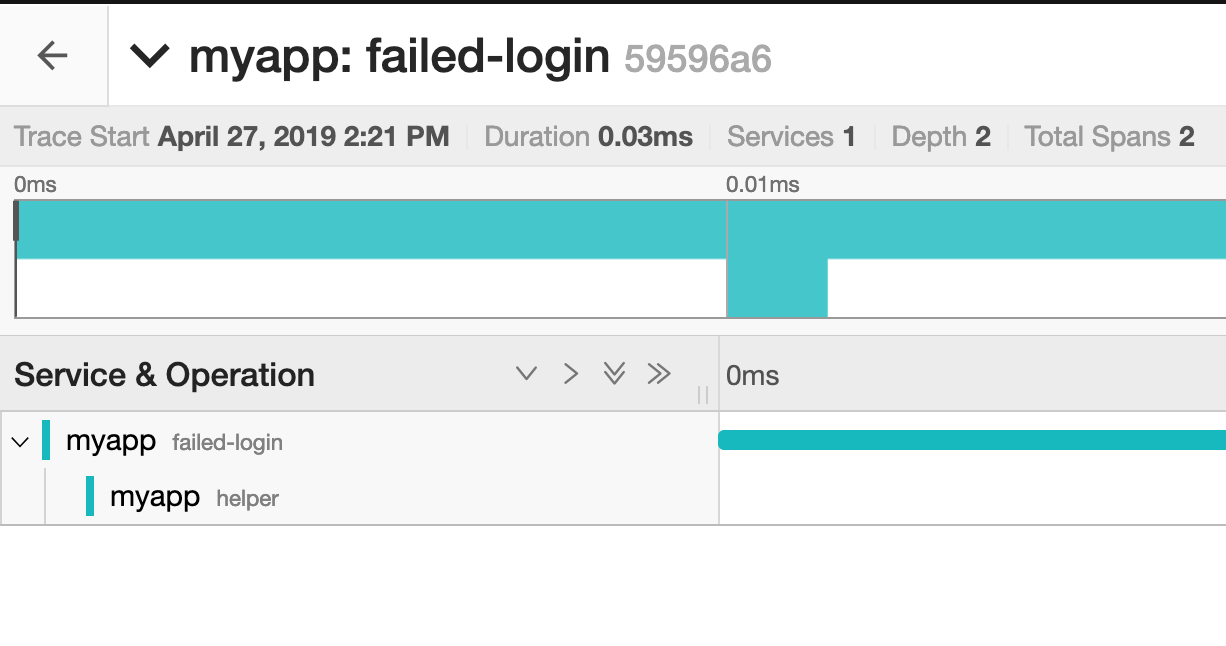
As you can see in the example above, when you start a new “span”, you receive a context back which you can then pass on to “sub-spans”. If we do that with another span for the operation “helper”, you get a rendering like this inside Jaeger:
In OpenTracing/Jaeger you’d do pretty much the same using the
opentracing.StartSpanFromContext call, which is far more verbose
than necessary. In general, except for the distinction between metrics
and views, the API feels more concise and more optimized for
best-practices compared to other APIs I’ve worked within the past.
Closing thoughts
The way exporters can be plugged into a project also makes the core of OpenCensus well-suited for integration into project templates. Coincidentally, that’s pretty much what I’m doing right now ;-) Additionally, there is currently work going on to merge OpenCensus and OpenTracing so the whole space will look even more interesting in a couple of months.
Complete example
You can find a complete example which I’ve used as basis for this post on https://github.com/zerok/opencensus-demo.
Do you want to give me feedback about this article in private? Please send it to comments@zerokspot.com.
Alternatively, this website also supports Webmentions. If you write a post on a blog that supports this technique, I should get notified about your link 🙂